


Contents:
Basics of VCP
Let's code the VCP logic
Code
Key functions & Parameters
Let’s collab/discuss the VCP market structure to improve the code
Introduction:
Recently, I finished reading Think and Trade Like a Champion by Mark Minervini. The book covers many fundamental and foundational concepts. However, three key ideas stood out to me that I wanted to convert into code:
The Trend Template
The MVP Scanner
The VCP Market Structure
In this post, I'll focus on the VCP (Volatility Contraction Pattern) and how I began structuring it using basic logic, deterministic parameters, and functions. Initially, I started in Jupyter Notebook, working with basic contractions, support/resistance levels, and volatility using standard deviation. After several iterations, I later optimized the model with the help of DeepSeek, which introduced machine learning functions for volatility anomalies, breakout detection, and other momentum and trend detection features.
Please note that this post does not present a final VCP scanner; it’s a part of my ongoing research to develop tools for trading. Thorough backtesting and further optimizations are necessary.
I have previously worked on other market structure scanners and screeners, such as Momentum Bursts and Episodic Pivots, which I manually backtested and traded.
I would love to hear your thoughts! Please comment or reach out to me — feedback from different perspectives is invaluable and often leads to more focused, efficient solutions. Thank you for reading, and I hope you enjoy it!
Basics of VCP
The most common characteristics shared by constructive price structures (stocks that are under accumulation) is a contraction of volatility accompanied by specific areas in the base where volume recedes noticeably.
Determining the correct VCP is the key to establishing the precise point and time to enter a stock. In virtually all the chart patterns look for volatility to contract from left side to right side.
Always look the stock moves from greater volatility on the left side of the price to lesser volatility on the right side.
During a VCP, you will generally see a sequence of anywhere from two to six price contractions. This progressive reduction in price volatility which is always accompanied by a reduction in volume at specific points, signifies that the base has been completed.
For example, a stock will initially come off by, say 25% percent from its absolute high to its low. Then the stock rallies a bit, and then sells of 15% percent. At that point buyers come back in, and the price rallies more within the base. Finally, it retreats by 8%.
As a rule of thumb, each successive contraction is generally contained to about half (plus or minus reasonable amount) of the previous pullback or contraction.
Volatility, measured from high to low, will be greatest when sellers rush to take profits. As sellers become scarcer, the price correction will not be as dramatic and volatility will decreases as the price makes its way to the right side of the base.
Typically most VCP setups will be formed by two to four contractions although sometimes there can be as many as five or six.
This actions will produce a pattern which also reveals the symmetry of the contractions being formed.
Imagine you have soaked a towel in water, and then wrung it out. Is it completely dry? No, it's still wet and contains some water. So you retwist the towel to wring it out some water. After more water comes out, is it dry now? Probably, it's at least damp. As you keep twisting and wrangling the towel to get all the water out, each time the drops will be less. Finally, the towel is dry and much lighter.
Similarly, with each contraction in a VCP, the price of the stock gets "tighter" - meaning it corrects less and less from left to right side on successively lower volume as the supply diminishes.
Like the wet towel being wrung dry, as a stock goes through several contractions, it becomes lighter and can move in one direction much more easily than when it was weighed down with lots of supply.
A price consolidation represents a period of equilibrium, as strong investors replace weak traders, supply is absorbed. Once the "weak hands" have been eliminated, the lack of supply allows the stock to move higher because even a small amount of demand will overwhelm the negligible inventory.
Tightness in price from absolute highs to lows and tight closes with little change in price from one day to the next and from one week to the next are generally constructive. These tight areas should be accompanied by a significant decrease in trading volume.
In some instance, volume dries up at or near the lowest levels establishes since the beginning of the stock's advance. This is a very positive development, especially if it takes place after a period of correction and consolidation, and is a tell tale sign that the amount of stock coming to the market has diminished.
A stock that is under accumulation will almost always shows these characteristics (price tightness with contracting volume). This is what you want to see before you initiate your purchase on the right side of the base, which forms what we call the pivot buy point.
The technical footprint
The quick reference is made up of three components:
1. Time: The number of days or weeks that have passed since the base started
2. Price: The depth of the largest correction and narrowness of the smallest contraction at the very right of the price base
3. Symmetry: The number of contraction throughout the entire basing process
Overhead supply
Before buying, you should wait until the stock goes through a normal process of shares changing hands from weak holders to stronger ones.
As a trader using a stop-loss, you are weak holder. The key is to be the least weak holder, you want as many of the weak hands as possible to exit the stocks before you buy.
You can tell supply has stopped coming to the market by the significant contraction in trading volume and significantly quieter price action as the right side of the base develops.
Demanding that your stocks meet these criteria before you buy improves the likelihood that your stock is off the public's radar, which helps you avoid a "crowded trade" and increases your chances of success.
If the stock's price and volume don't quiet down on the right hand of the consolidation, supply most likely is still coming to market, making the trade too risky and prone to failure.
What does VCP Tells Us?
The VCP is evidence of the law of supply and demand at work as the stock goes through an orderly process of changing from weak hands to stronger hands. During the volatility contraction, increasingly less supply comes to the market. As willing long term buyers meet eager short term sellers the overhead supply that has been holding the stock back dissipates.
It is important to keep in mind that the VCP occurs within the confines of an uptrend. The VCP is going to happen at higher level, after the stock has already moves up 30,40 and 50 percent or even much more, because the VCP is a continuation pattern as part of a much larger upward move.
Critical components of VCP
1. Price base formation: Before contraction, there should be proper base formation
2. Contraction: Each contraction should be smaller compared to the previous contraction
3. Volume: Decreasing volume during the contraction phase and increase during the breakout
4. Breakout: The price should break above the contraction zone with increase volume
Simplifying into Steps:
Step 1: High Demand - Building Momentum
Look for stocks with a high demand, look for a strong uptrend price movement
The best VCP patterns occur after big strong moves
Step 2: Contraction from left to right - Selling Pressure
After the strong uptrend, the asset will experience an increased selling pressure, as same traders decide to take profits at that point, leading into a period of consolidation.
The compression created between buyers and sellers makes the stock go through retracements.
If it is observed that the trading range is getting smaller is each of the new retracement, it shows the stock has a great foundation of uptrend momentum, which is a bullish signal.
Step 3: Decreasing Volatility - Reduced Selling Pressure
Moving on to the next stage, traders could observe that the price and volume are getting tighter and lows are also getting higher. The tightening indicates a decrease in selling pressure, and the stock price should hold a support level like moving average or VWAP. Traders should closely monitor this period as it signifies a potential shift in market sentiment and possible entry opportunity.
Step 4: Breakout - Capitalizing on increased demand
Make entry before potential breakout
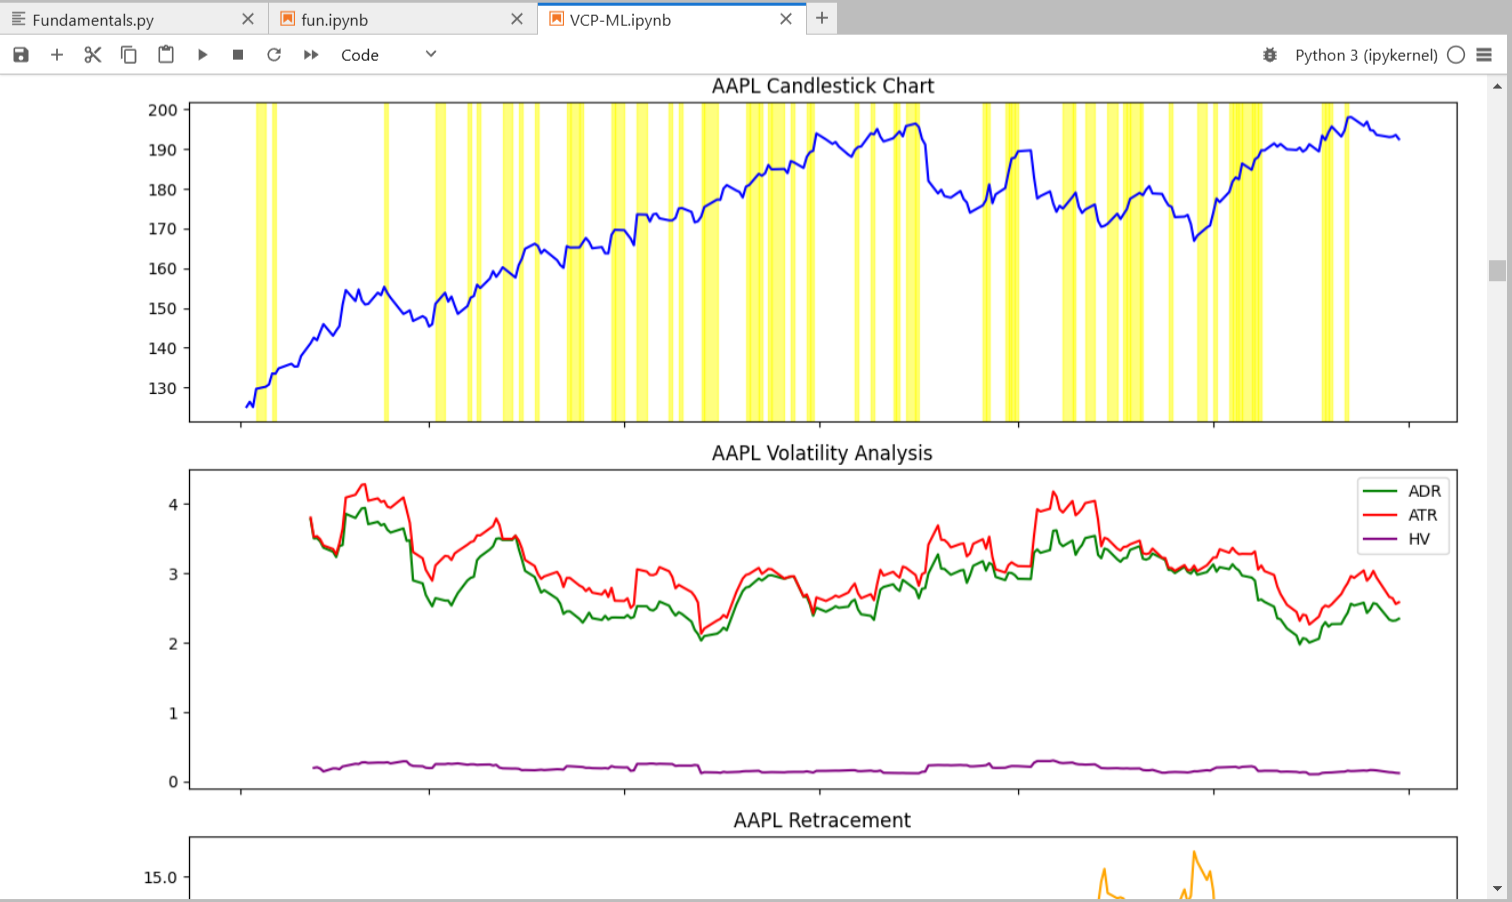
ADR and ATR ~ Compression : Expansion Estimation
Average Day Range(ADR) only looks at how much the price moves between the high and low on a given day. This is the day range or DR, which when averaged to create ADR
Day Range = Daily High - Daily Low
Average True Range(ATR) = Sum of the least 14 DR / 14
With ADR indicator only the average is shown not the individual
Expansion or Expanding Ranges === ATR
Contraction or Contracting Ranges == ADR
ATR and ADR are for objectifying the volatility.
Let's code the VCP logic
Threshold Parameters for the Scanner
Price contraction levels: Each contraction should be 50-60% smaller than the prior one.
ATR reduction: Minimum of 20% reduction in ATR over the base period.
Volume decrease: 30-50% below the average during contractions.
Breakout volume: At least 50% above the 20-day average volume.
Base duration: Minimum of 30 trading days.
Code:
import yfinance as yf

import pandas as pd

import numpy as np

import talib as ta

from sklearn.ensemble import IsolationForest

from sklearn.impute import SimpleImputer

# Configuration

LOOKBACK_PERIOD = "6mo"

MIN_BASE_DURATION = 30

RSI_PERIOD = 14

ATR_PERIOD = 14

KC_PERIOD = 20

VOLUME_SPIKE_MULTIPLIER = 1.5

ADX_PERIOD = 14

def safe_convert_data(df):

    """Robust data cleaning with NaN handling"""

    numeric_cols = ['Open', 'High', 'Low', 'Close', 'Volume']

    df[numeric_cols] = df[numeric_cols].apply(pd.to_numeric, errors='coerce')

    df.dropna(subset=numeric_cols, how='all', inplace=True)

    df.ffill(inplace=True)

    df.bfill(inplace=True)

    return df

def calculate_technical_indicators(df):

    """NaN-safe indicator calculation"""

    df = safe_convert_data(df)

    if len(df) < max(ATR_PERIOD, KC_PERIOD, ADX_PERIOD) * 2:

        return pd.DataFrame()

    try:

        # Price indicators

        df['MA20'] = df['Close'].rolling(20, min_periods=10).mean()

        df['MA50'] = df['Close'].rolling(50, min_periods=25).mean()

        # Volatility indicators

        df['EMA20'] = df['Close'].ewm(span=KC_PERIOD, min_periods=KC_PERIOD//2, adjust=False).mean()

        df['ATR'] = ta.ATR(df['High'], df['Low'], df['Close'], ATR_PERIOD)

        df['Upper_KC'] = df['EMA20'] + 2 * df['ATR']

        df['Lower_KC'] = df['EMA20'] - 2 * df['ATR']

        df['KC_Width'] = (df['Upper_KC'] - df['Lower_KC']) / df['EMA20']

        # Momentum indicators

        df['ADX'] = ta.ADX(df['High'], df['Low'], df['Close'], ADX_PERIOD)

        df['PlusDI'] = ta.PLUS_DI(df['High'], df['Low'], df['Close'], ADX_PERIOD)

        df['MinusDI'] = ta.MINUS_DI(df['High'], df['Low'], df['Close'], ADX_PERIOD)

        df['RSI'] = ta.RSI(df['Close'], RSI_PERIOD)

        # ML Anomaly Detection

        imputer = SimpleImputer(strategy='median')

        clean_data = imputer.fit_transform(df[['ATR', 'Volume']])

        model = IsolationForest(contamination=0.1, random_state=42)

        df['Anomaly_Score'] = model.fit_predict(clean_data)

        return df.dropna()

    except Exception as e:

        print(f"Indicator error: {str(e)}")

        return pd.DataFrame()

def analyze_vcp(symbol, df):

    """Generates complete output with all columns"""

    # Initialize result with default values

    result = {

        'Symbol': symbol,

        'VCP': False,

        'Contractions': 0,

        'Volatility_Decrease': 'N/A',

        'ADX_Strength': False,

        'DI_Bullish': False,

        'RSI_Value': 0,

        'Price_Increase': '0%',

        'Anomaly_Free': False,

        'Volume_Contraction': False,

        'Breakout_Detected': False,

        'Reason': 'Initial error'

    }

    try:

        if df.empty or len(df) < MIN_BASE_DURATION:

            result['Reason'] = 'Insufficient data'

            return result

        # Uptrend check

        price_increase = (df['Close'].iloc[-1] - df['Close'].iloc[0]) / df['Close'].iloc[0]

        result['Price_Increase'] = f"{price_increase*100:.1f}%"

        if price_increase < 0.3 or df['Close'].iloc[-1] < df['MA50'].iloc[-1]:

            result['Reason'] = 'Invalid uptrend'

            return result

        # Contraction analysis

        contractions = []

        closes = df['Close'].values

        i = len(df) - 1

        contraction_count = 0

        while i > 0 and contraction_count < 6:

            if closes[i] < closes[i-1]:

                start = i

                while i > 0 and closes[i] < closes[i-1]:

                    i -= 1

                end = i

                high = df['High'].iloc[start:end+1].max()

                low = df['Low'].iloc[start:end+1].min()

                retracement = (high - low) / high

                if contractions and retracement > contractions[-1]['retracement'] * 0.6:

                    break

                contractions.append({

                    'retracement': retracement,

                    'kc_width': df['KC_Width'].iloc[start:end+1].mean()

                })

                contraction_count += 1

            i -= 1

        result['Contractions'] = len(contractions)

        if len(contractions) < 2:

            result['Reason'] = 'Insufficient contractions'

            return result

        # Pattern validation

        valid_contractions = all(

            contractions[i]['retracement'] < contractions[i-1]['retracement'] * 0.6

            for i in range(1, len(contractions))

        )

        kc_contraction = all(

            contractions[i]['kc_width'] < contractions[i-1]['kc_width']

            for i in range(1, len(contractions))

        )

        # Additional metrics

        result.update({

            'ADX_Strength': df['ADX'].iloc[-1] > 25,

            'DI_Bullish': df['PlusDI'].iloc[-1] > df['MinusDI'].iloc[-1],

            'RSI_Value': round(df['RSI'].iloc[-1], 1),

            'Anomaly_Free': df['Anomaly_Score'].iloc[-1] == 1,

            'Volatility_Decrease': f"{(df['KC_Width'].iloc[-60:-30].mean()/df['KC_Width'].iloc[-10:].mean()-1)*100:.1f}%" if len(df) > 60 else 'N/A',

        })

        # Volume analysis

        recent_volume = df['Volume'].iloc[-10:].mean()

        contraction_volume = np.mean([c['kc_width'] for c in contractions[-2:]])

        result['Volume_Contraction'] = contraction_volume < recent_volume * 0.7

        # Breakout check

        resistance = df['High'].iloc[-20:-1].max()

        current_close = df['Close'].iloc[-1]

        volume_spike = df['Volume'].iloc[-1] > df['Volume'].rolling(20).mean().iloc[-1] * VOLUME_SPIKE_MULTIPLIER

        result['Breakout_Detected'] = current_close > resistance and volume_spike

        # Final decision

        result['VCP'] = all([

            valid_contractions,

            kc_contraction,

            result['Volume_Contraction'],

            result['Breakout_Detected'],

            result['Anomaly_Free']

        ])

        result['Reason'] = 'Valid pattern' if result['VCP'] else 'Failed checks'

    except Exception as e:

        result['Reason'] = f"Analysis error: {str(e)}"

    return result

def scan_vcp(csv_path):

    """Generates complete output DataFrame"""

    symbols = pd.read_csv(csv_path)['Symbol'].tolist()

    results = []

    for symbol in symbols:

        try:

            data = yf.download(symbol, period=LOOKBACK_PERIOD, progress=False)

            data = calculate_technical_indicators(data)

            if not data.empty:

                analysis = analyze_vcp(symbol, data)

            else:

                analysis = {

                    'Symbol': symbol,

                    'VCP': False,

                    'Reason': 'Data unavailable',

                    'Contractions': 0,

                    'Volatility_Decrease': 'N/A',

                    'ADX_Strength': False,

                    'DI_Bullish': False,

                    'RSI_Value': 0,

                    'Price_Increase': '0%',

                    'Anomaly_Free': False,

                    'Volume_Contraction': False,

                    'Breakout_Detected': False

                }

            results.append(analysis)

        except Exception as e:

            results.append({

                'Symbol': symbol,

                'VCP': False,

                'Reason': f"Processing error: {str(e)}",

                'Contractions': 0,

                'Volatility_Decrease': 'N/A',

                'ADX_Strength': False,

                'DI_Bullish': False,

                'RSI_Value': 0,

                'Price_Increase': '0%',

                'Anomaly_Free': False,

                'Volume_Contraction': False,

                'Breakout_Detected': False

            })

    return pd.DataFrame(results)

if __name__ == "__main__":

    results_df = scan_vcp('../Data/sources/Index/NYSE01.csv')

    if not results_df.empty:

        print("\nVCP Scan Results:")

        print(results_df[results_df['VCP']])

        print("\nFull Analysis:")

        print(results_df)

        results_df.to_csv("./vcp_results.csv", index=False)

        # Load a CSV file into a DataFrame

        df = pd.read_csv("./vcp_results.csv")

        # Drop rows with any NaN values

        df_cleaned = df.dropna()

        # Save the filtered DataFrame to a new CSV file

        df_cleaned.to_csv("./cleaned_file.csv", index=False)

        print("Filtered data saved to cleaned_file.csv")

    else:

        print("\nNo valid data processed - check input symbols or data availability")
Key functions & Parameters
Machine Learning Function (Isolation Forest)
#In calculate_technical_indicators()
imputer = SimpleImputer(strategy='median')
clean_data = imputer.fit_transform(df[['ATR', 'Volume']])
model = IsolationForest(contamination=0.1, random_state=42)
df['Anomaly_Score'] = model.fit_predict(clean_data)
Purpose: Detect unusual trading activity that might distort pattern recognition. Identifies irregular trading patterns in stock data (e.g., sudden volume spikes, abnormal volatility) that could distort VCP pattern recognition.
Features Used:
ATR (Average True Range): Measures market volatility
Volume: Trading volume analysis
Parameters:
contamination=0.1: Expect 10% of data points to be anomalies
random_state=42: Ensures reproducibility
Output:
Anomaly_Score: -1 for anomalies, 1 for normal points
Why Isolation Forest?:
Linear time complexity (O(n)O(n)) and low memory usage, ideal for large financial datasets.
Outperforms distance/density-based methods (e.g., k-NN, LOF) in high-dimensional data.
Does not assume data distribution, making it suitable for dynamic stock markets.
Handles clustered or varying-density data (common in multi-stock analyses).
Practical Example:
Scenario: A stock exhibits a 300% volume spike due to a rumor.
Isolation Forest : Flags this as an anomaly (`Anomaly_Score = -1`).
VCP Check: Skips further analysis, avoiding false breakout signals.
Outcome: Reduces false positives and focuses on structurally sound patterns
Trend Validation Parameters
price_increase = (df['Close'].iloc[-1] - df['Close'].iloc[0]) / df['Close'].iloc[0]

price_increase < 0.3  # Minimum 30% price increase over lookback

perioddf['Close'].iloc[-1] < df['MA50'].iloc[-1]  # Price above 50-day MA
Contraction Parameters
retracement = (high - low) / high  # Price retracement calculation

retracement > contractions[-1]['retracement'] * 0.6  # Max 40% of previous retracement

len(contractions) < 2  # Minimum 2 valid contractions
Volatility Parameters
df['KC_Width'] = (Upper_KC - Lower_KC) / EMA20  # Normalized volatility measure

kc_contraction = all(...)  # Requires decreasing Keltner Channel width
Volume Parameters
VOLUME_SPIKE_MULTIPLIER = 1.5  # 150% of 20-day average volume

contraction_volume < recent_volume * 0.7  # 30% volume reduction in contraction phase
Momentum Parameters
ADX > 25  # Strong trend confirmation

PlusDI > MinusDI  # Bullish directional movement

RSI between 30-70 (implicit check through value monitoring)
analyze_vcp() Decision Logic
1. Uptrend Requirement:
30%+ price increase
Price above 50-day MA
2. Contraction Structure:
At least 2 successive contractions
Each contraction ≤ 50% of previous retracement
Volatility (KC Width) must decrease with each contraction
3. Volume Signature:
Volume reduction during contractions
Volume spike on breakout
4. Momentum Confirmation:
ADX > 25 (strong trend)
Positive Directional Index (PlusDI > MinusDI)
RSI not overbought (<70)
5. Anomaly Filter: Filters out stocks with unusual trading activity
result['Anomaly_Free'] = df['Anomaly_Score'].iloc[-1] == 16. Breakout Validation:
Support/Resistance Identification:
# Dynamic resistance calculation

resistance = df['High'].rolling(window=20).max().shift(1).iloc[-1]
Identifies recent price ceilings (resistance) or floors (support)
Uses rolling maximum/minimum of highs/lows
Breakout Confirmation:
# Price action validation

current_close = df['Close'].iloc[-1]

previous_close = df['Close'].iloc[-2]

valid_breakout = (

       current_close > resistance and        # Price clears level

       current_close > previous_close and    # Momentum confirmation

        (current_close - resistance) > 0.005 * resistance  # Minimum 0.5% clearance
)
Results & Screenshot:
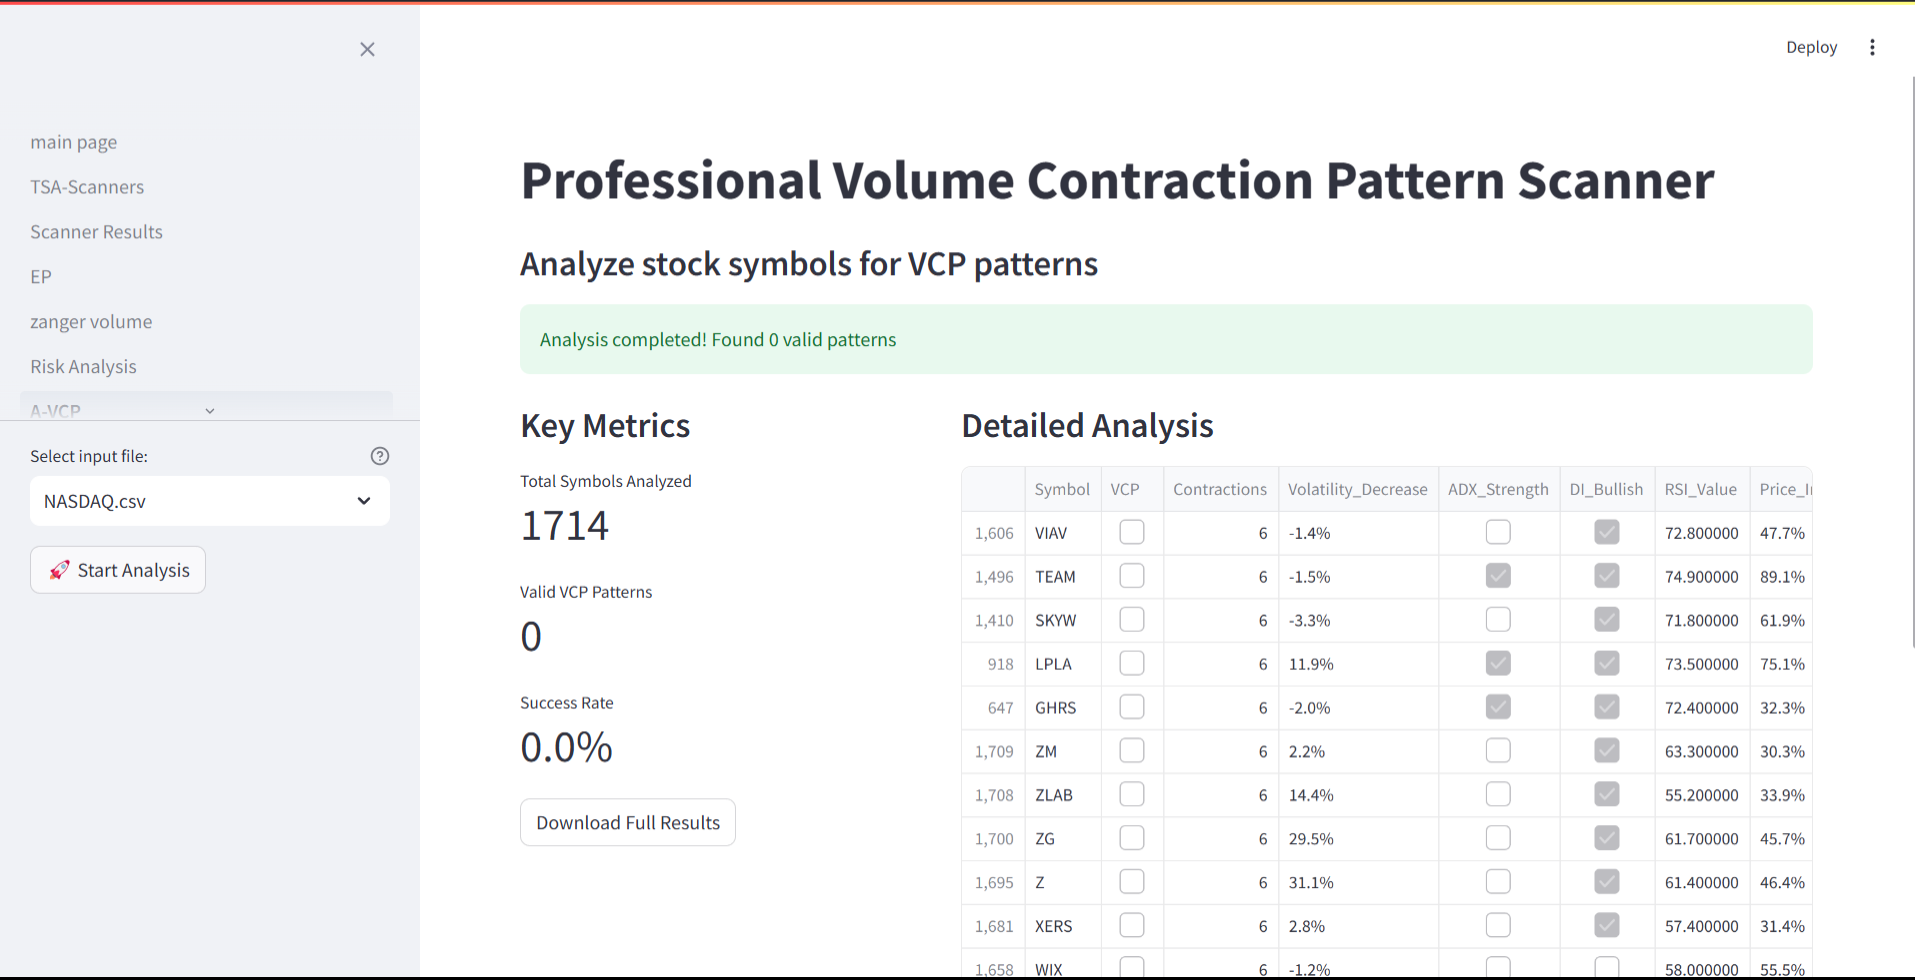
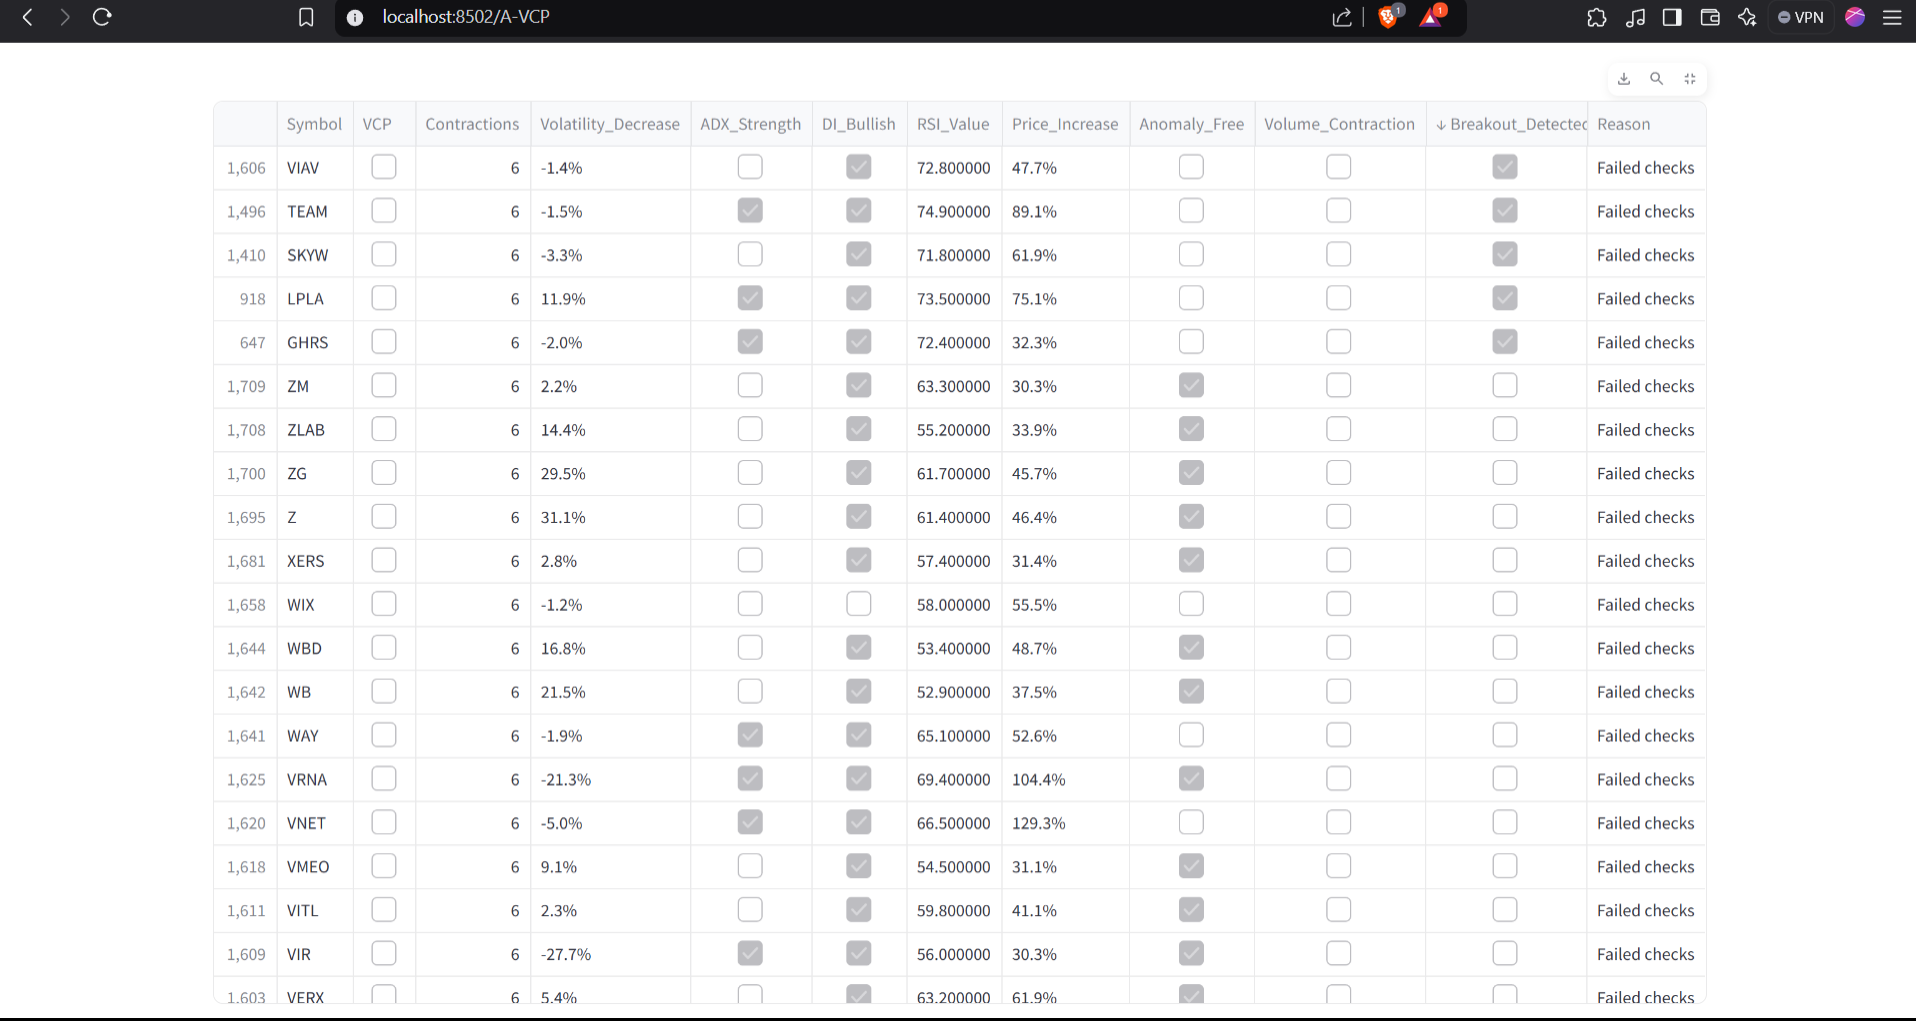
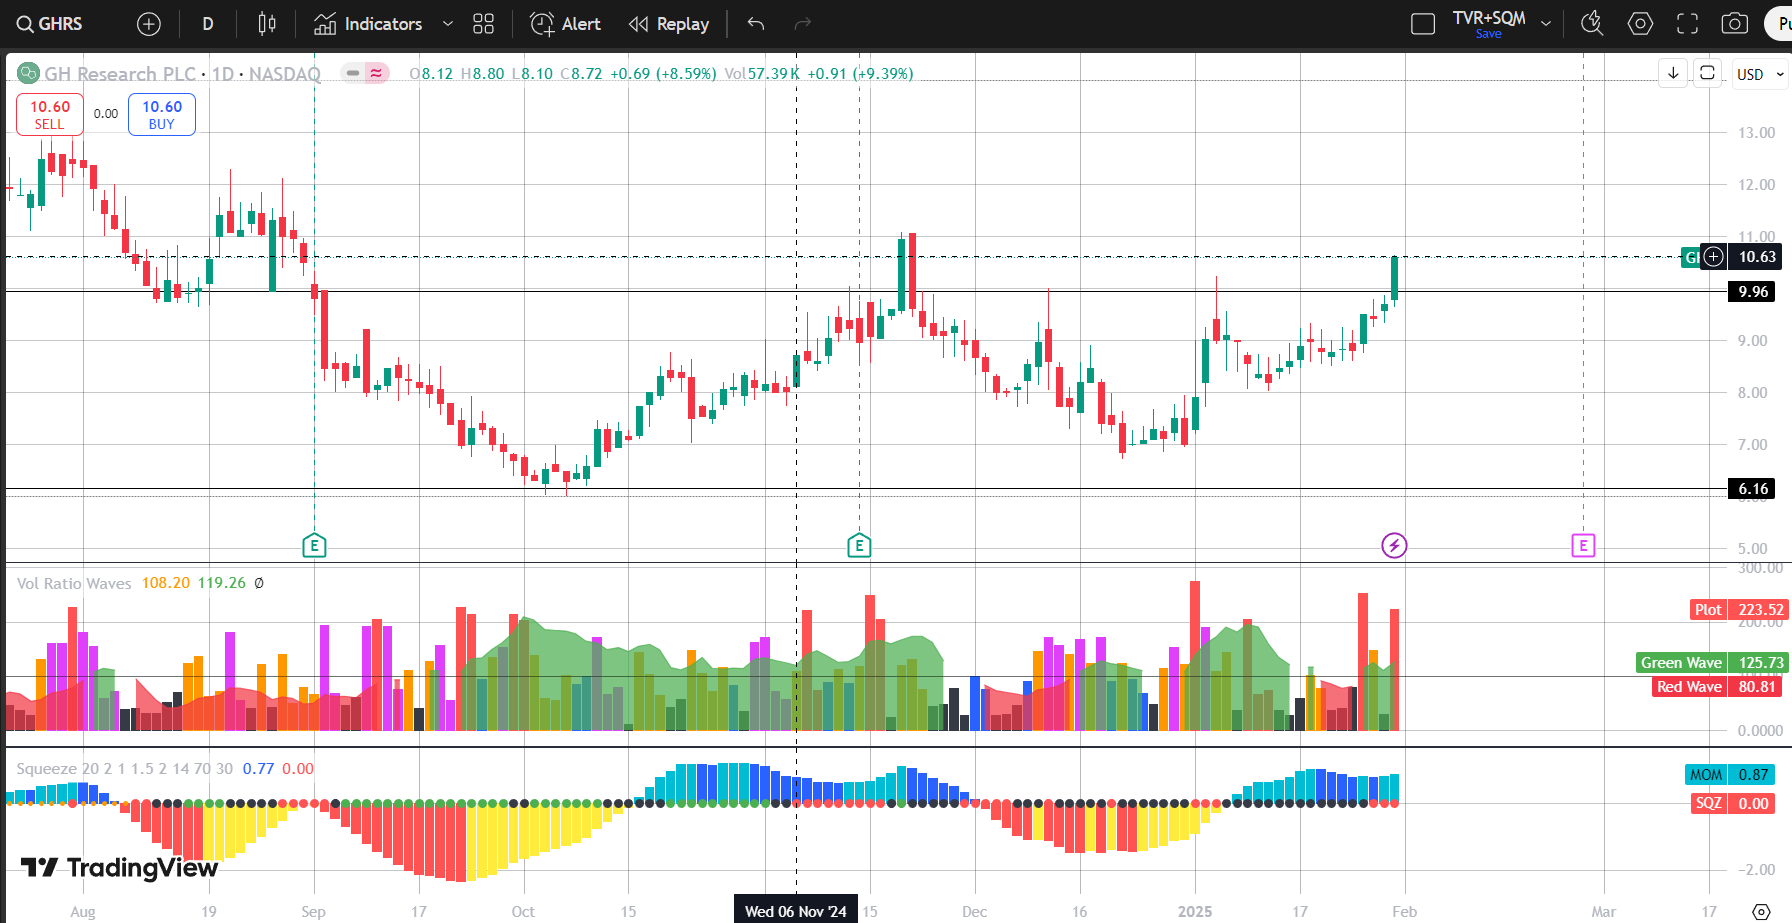
GHRS showing good VCP and code detected it with breakout detection.
Previous iterations:
Important Considerations
Before diving deeper into this approach, please keep the following in mind:
Code Iterations and Optimization: This is just one iteration of the code and logic. There is room for optimization and improvement.
Limited Testing: The current implementation has been tested only 10-15 times, so extensive backtesting is essential to validate its robustness.
Further Backtesting Required: It's critical to backtest the VCP (Volatility Contraction Pattern) code to ensure its effectiveness.
Exploring Additional Approaches: Consider incorporating other mathematical models and price action strategies to refine the analysis.
If you have insights, feedback, or want to collaborate, feel free to drop me a message on Twitter: @tikamalma.
Thanks you bro