


The Art of Profit, Pricing, and Perfect Customer Segmentation

Contents:
1. Introduction: Understanding ARPA (Average Revenue Per Account) and the Importance of Customer Segmentation
2. Matching Companies to Revenue Segments: How Real-World Businesses Fit into Different Revenue Models and Customer Bases
3. In-Depth Look at Profit Margins: Exploring Industry-Specific Margins and What Drives Profitability Across Sectors
4. Further Reading and References: Essential Resources for Scaling Revenue and Maximizing Profit Margins
Imagine being a kid with only ₹10 in your pocket, dreaming of a ₹1000 game console. The trick? Finding a smart way to earn those extra ₹990 by scaling your approach – selling Pokémon cards to your classmates, selling lemonade, or flipping video game ROMs. Building a business is no different; to hit big revenue milestones, you need the right mix of customer segments and pricing.
Sell 100 students Pokémon cards worth 10rs each
Sell 10 students video games ROM worth 100rs each
Sell 1000 students 1rs lemonade per glass
In today’s landscape, the game scales up: to build a $100 million business, your approach needs to be strategic. Should you attract a thousand enterprise customers willing to pay $100k annually? Or focus on smaller players, who might pay less but come in larger numbers? Let's dive into the segmentation and pricing secrets that fuel growth, profits, and help make that dream of $100 million a reality.
To build a Web company with $100 million in annual revenues*, you essentially need:
1,000 enterprise customers paying you $100k+ per year each; or
10,000 medium-sized companies paying you $10k+ per year each; or
100,000 small businesses paying you $1k+ per year each; or
1 million consumers or "prosumers" paying you $100+ per year each (or, in the case of eCommerce businesses, 1M customers generating $100+ in contribution margin** per year each); or
10 million active consumers who you monetize at $10+ per year each by selling ads
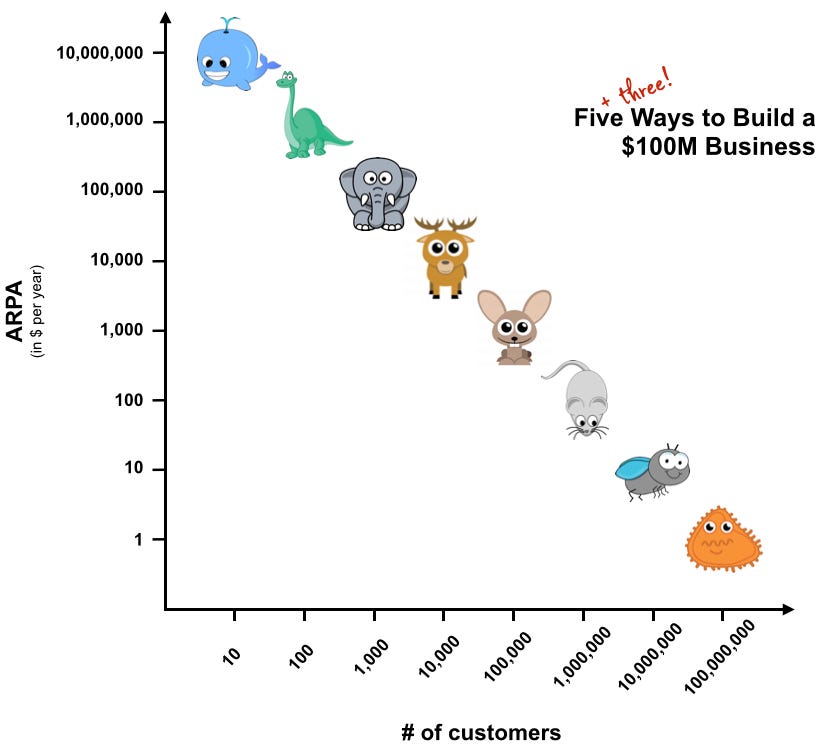
Now let's look at the figures:
Customer Segment = Number of customer X ARPA ( average revenue per account per year)
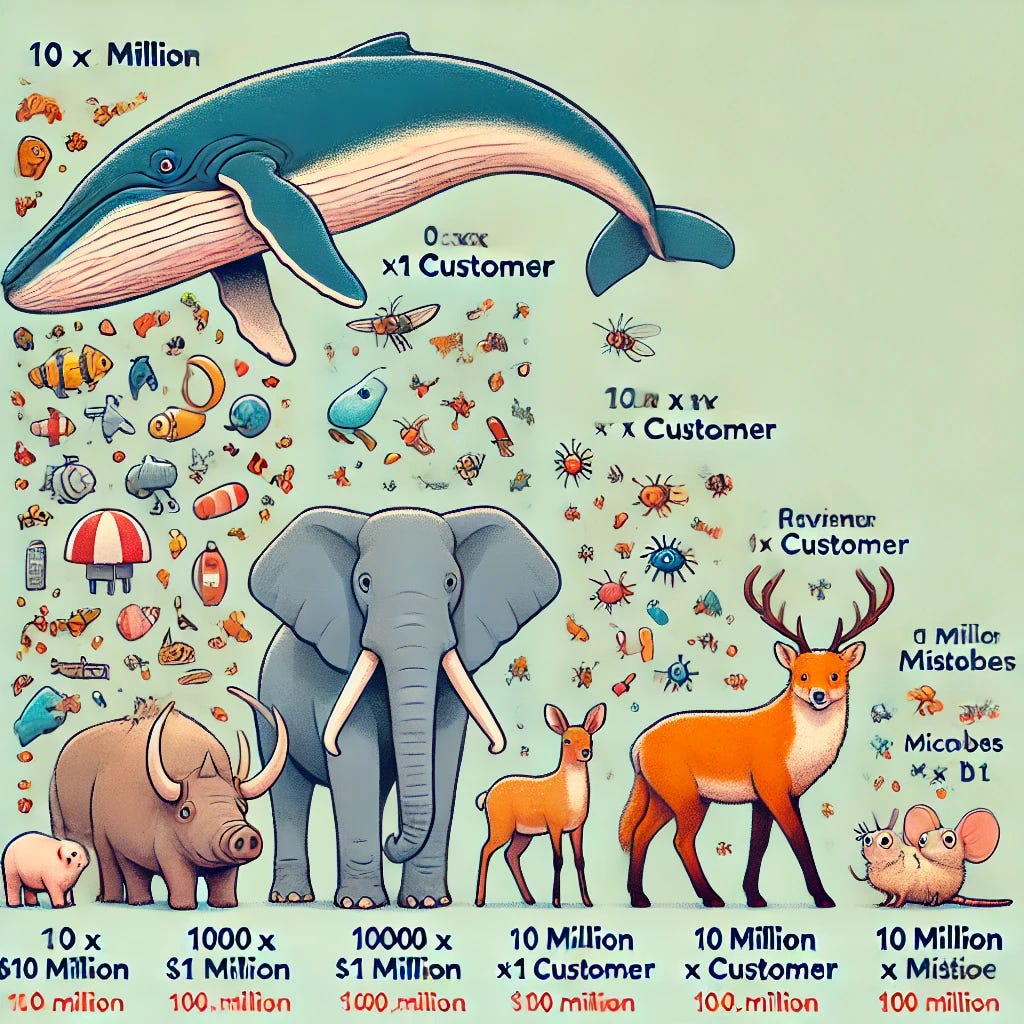
The Whales = 10 X $10 Million
The Dinosaurs (**Brontosaurus**) = 100 X $1 Million
The Elephant = 1000 X $100K
The Deer = 10,000 X $10K
The Rabbit = 100,000 X $1K
The Mice = 1 Million X $100
The Flies = 10 Million X $10
The Microbes = 100 Million X $1 ($1 per user per year)
Let’s Match Companies to Their Revenue Categories
Finding which companies fall under each revenue category is essential to understand real-world applications of scaling strategies. Here’s how companies typically align with each segment:

To reach $100 million in annual revenue, your customer acquisition channels must be both highly scalable and profitable. Without this balance, it’s nearly impossible to reach the necessary customer volume at your target Average Revenue Per Account (ARPA). The challenge? Most acquisition channels are either scalable or profitable—but rarely both.
A crucial factor when defining your business’s north star metrics is knowing your customer and their specific segment. This foundational understanding allows you to build effective strategies and product plans tailored to your audience, setting you up for sustainable growth and profitability.
Lets deep dive into profit margins
What is profit margin?
Imagine you're selling something for 100 INR. You earn 20 INR as profit. To find your profit margin, divide your profit by the price you sold it for.
If you sell the product for 120 INR (which is 20% more than the original price of 100 INR), your profit would be 20 INR (120 - 100). As a percentage, this is 20%.
In simple terms, profit margin is a way to measure how much of each dollar in revenue goes towards paying for things that cost more (like production, marketing, etc.) rather than just keeping the money you earn from selling something.
The formula to calculate profit margin is:
Profit Margin = (Profit / Selling Price) x 100
Gross Profit Margin
The gross profit margin is a measure of how much of each Rupees in revenue goes towards generating profits, excluding the costs of goods sold (COGS). It's calculated by dividing the gross profit by the net sales price. Gross profit margin is a metric that measures profit by taking "total sales revenue" and subtracting it by the "cost" to make the product (COGS).
Gross Profit = Selling Price - COGS
Net Sales Price = Selling Price - Cost of Goods Sold (COGS)
The formula to calculate the gross profit margin is:
Gross Profit Margin = (Gross Profit / Net Sales Price) x 100
Where:
Gross Profit is the amount earned from selling a product or service, excluding COGS.
Net Sales Price is the price at which you sell the product or service after deducting COGS.
For example, if your gross profit is ₹20 and your net sales price is ₹120, your gross profit margin would be:
Gross Profit Margin = (₹20 / ₹120) x 100
= 16.67%
This means that for every dollar you earn from selling the product, 16.67 cents go towards paying for things that cost more (like production, marketing, etc.).
Net profit margin
Net profit margin takes everything into account including operating costs (employee payroll, electricity bills, equipment costs etc.), taxes and other miscellaneous expenses.
Gross profit margin only takes into account the cost of goods required to make the product.
The formula for calculating net profit margin is the same as gross profit margin, except you add in those additional costs:
**Net Profit Margin** = (Revenue - Costs) / Revenue
Exploring Real-World Profit Margins: How Different Businesses Stack Up
In the real world, profit margins vary significantly across industries based on factors like operating costs, customer acquisition expenses, and product scalability. Here’s a breakdown of profit margins across different types of businesses to see how they reach profitability targets:

While profit alone is an important metric for tracking a company's success, it doesn't necessarily reflect their ability to innovate and deliver value to customers.
Consider the following three possible ways of generating $5,00,000 in revenue:
A company with $10M in revenue generates $5,00,000 in profit with 5% profit margin
A company with $5M in revenue generates $5,00,000 in profit with 10% profit margin
A company with $2.5M in revenue generates $5,00,000 in profit with 20% profit margin
Each company generates the same $500,000 profit, so the results look identical by that measure. However, when looking at the ratio of profit to revenue, when you consider some critical business measures, the 20% profit margin indicates stronger performance than the results shown by the larger companies.
Profit margin is indeed the single best metric to gauge a company's overall performance. It helps determine whether a company has been able to generate a good return on its investments, which is crucial for success in any industry.
To have a high profit margin requires several key factors:
The company can generate a large amount of revenue per employee.
No need to pay higher than market rates for employees.
Proper management of fixed costs, including rent, salaries, and other operational expenses.
Strategic pricing that maximizes sales volume without compromising the bottom line.
Profit margin that is higher than your competitors’ is something that catches the eye of investors and analysts.