
Fundamental Analysis - 01
Decoding the Numbers: A Beginner's Guide to Fundamental Analysis in Investing


In the intricate world of investing, understanding the language of numbers can be the key to unlocking the potential of your portfolio. Fundamental analysis, often hailed as the cornerstone of successful investment strategies, goes beyond mere stock price trends. It delves into the fundamental aspects of a company's financial health, providing a comprehensive view that goes beyond the surface. In this post, we'll explore some fundamental metrics that are crucial for investors to grasp, such as the Price-to-Earnings (PE) ratio, Earnings Per Share (EPS), Debt-to-Equity ratio, Return on Capital Employed (ROCE), and Return on Equity (ROE). So, buckle up as we embark on a journey to demystify these numbers and empower you to make more informed investment decisions. Whether you're a seasoned investor or just dipping your toes into the financial waters, this guide is designed to make fundamental analysis accessible and actionable. Let's dive in!
The fundamental analysis should help us understand the following key questions:
What is the market capitalisation of a company? Is the company growing and earning profits?
Is my target company under debt? What is their debt-to-equity ratio?
Is the company undervalued or overvalued in terms of its market and book value, sales, earnings, and profits?
What is their price per earnings and price per earnings growth ratios?
What are the returns on assets and equities? What is the dividend payout ratio?
1. Valuation
1.1 Market Capitalisation:
Let’s start by understanding what market capitalisation is. Market capitalisation, or market cap, is a measure that helps determine the size of a company. It categories a company into large, medium, or small-sized based on its market cap.
Market Cap = Outstanding Shares * Current Price per Share
Or you can get the numbers of share currently circulating in the market by:
Current Outstanding Share = Market Cap / Current Price per Share
The market cap figure reflects the market value of a company. Here's how we categorize companies based on their market cap:
Example:
Let's consider Company XYZ with 100 million outstanding shares and a current share price of $120.
Market Cap of XYZ = 100,000,000 shares * $120/share = $12,000,000,000 (12 Billion)
We can further break the cap down into more categories if needed. Generally, it’s wise to diversify the portfolio and add a mix of large, medium, and small-cap companies’ stocks in the portfolio.
1.2 PS Ratio
The P/S ratio, or Price-To-Sales Ratio, is a metric used to gauge how much the market capitalisation of a company exceeds its sales. Typically, the past 12 months' sales are considered when calculating this ratio. It is essentially the ratio of market capitalisation to the sales of a company, providing insights into how much investors are paying for one dollar of the company's sales.
The PS ratio is computed by dividing the market capitalisation of the share by the total sales of a company. As the number of outstanding shares or the share price of a company increases, the PS ratio also increases. Conversely, if the sales of a company decrease, the PS ratio tends to increase.
Example:
Let's continue with Company XYZ, which has a market cap of $12 Billion and total sales of $4 Billion in the past 12 months.
In this example, the PS ratio for Company XYZ is 3, indicating that investors are paying $3 for every dollar of the company's sales.
Investors often use the PS ratio to assess whether a stock is overvalued or undervalued relative to its sales. A lower PS ratio might suggest that the stock is undervalued, while a higher ratio may indicate overvaluation. It's important to consider industry averages and compare the ratio with peers for a more comprehensive analysis.
The key point to take is that if the ratio is lower than 1 then the company is undervalued and if the ratio is greater than 1 then the company is overvalued. Generally, the higher the value, the more the stock is valued by the investors.
1.3 Earnings per Share (EPS)
This is the portion of a company’s profit that is assigned to each share of its stock. It’s essentially the bottom line net income, just on a per-share basis. A growing EPS is a good sign to investors because it means that their shares are likely to be worth more.
You can calculate the earnings per share of a company by dividing its total profit by the number of outstanding shares. For example – If the company reports a profit of $350 million and there are 100 million shares, then the EPS is $3.50.
EPS stands for Earnings Per Share, and it is a financial metric that represents the portion of a company's profit attributable to each outstanding share of common stock. EPS is an important measure for investors, as it provides insights into a company's profitability on a per-share basis.
The formula to calculate EPS is:
EPS = (Net Income - Dividends on Preferred Stock) / Weighted Average Number of Outstanding Shares
The EPS figure can be used by investors to evaluate a company's profitability and compare it to other companies in the same industry. Higher EPS generally indicates better profitability on a per-share basis, but it's important to consider other factors such as the company's growth prospects, industry conditions, and overall financial health.
The earnings per share inform us how much the company makes per share. It is merely the total earnings of a company divided by the outstanding shares. If the EPS is positive then the company is profitable. Therefore it makes more than it costs.
1.4 Price-to-earnings, or P/E, ratio
The price-to-earnings (P/E) ratio is quite possibly the most heavily used stock ratio. The P/E ratio—also called the "multiple"—tells you how much investors are willing to pay for a stock relative to its per-share earnings.
Computing the P/E is simple: just divide the stock's share price by its earnings per share (EPS). For example, if a stock has a P/E ratio of 20, it means investors are willing to pay up to 20 times its EPS to own it. But is that too much or too little? Expensive or cheap?
The P/E ratio is a broader valuation metric that compares the market price of a share to its earnings. It is calculated as:
P/E Ratio=Market Price per Share / Earnings Per Share (EPS)
P/E Ratio= Market Capitalisation / Net Income
In this formula, the market capitalisation is the total market value of a company's outstanding shares.
Stock Price = PE X EPS
PE = Stock Price / EPS
Let's consider a company called ABC Inc. Currently, ABC's stock is trading at $40 per share. The company's Earnings Per Share (EPS) is $4.
P/E Ratio = $40/$4 = 10
In this example, the P/E ratio for ABC Inc. is 10. This means investors are willing to pay 10 times the company's earnings per share to own a share of ABC's stock.
Interpretation:
High P/E Ratio: If a company has a high P/E ratio (e.g., 20 or higher), it suggests that investors are willing to pay a premium for each dollar of earnings. This might indicate high expectations for future growth.
Low P/E Ratio: Conversely, a low P/E ratio (e.g., below 10) may suggest that the stock is relatively more affordable. It could be because investors have lower expectations for future growth or there might be concerns about the company's prospects.
There are two main types of PE ratios; forward-looking and trailing PE ratio. The difference between the two has to do with what types of earnings are used in the calculation. If the one year projected (future) earnings are used as the denominator in the calculation, then the result is a forward-looking PE ratio. Whereas, if the historical trailing 12-month earnings are used, then you’ll get the trailing PE ratio as the result.
Company with a higher PE ratio usually has a higher earnings growth rate.
Note: The key point to take is that PE needs to be compared with the companies within the same industry. The higher the value, the more the company is valued.
1.5 Projected Earnings Growth (PEG)
You may know a stock's P/E ratio, but how does such a number stand relative to its projected growth rate? A company's P/E may seem "cheap," but if the company doesn't grow, what's the point of holding on to a stock with a low P/E?
The PEG ratio is also known as the Price To Earnings Ratio Over Earnings Growth Rate. This is computed by calculating the PE ratio and dividing by the earnings growth. We can use the annual earnings growth rate.
We can use the PEG ratio to compute the true value of a stock. The lower the PEG ratio, the undervalue the stock is. The PEG ratio can help us understand how fast a company can grow.
The PEG is derived by dividing the P/E ratio by projected EPS growth. For example, a stock with a P/E of 18 and a percentage growth rate of 15% would carry a PEG of 1.2. So, how should you read this number? Typically, stocks with a PEG ratio of less than 1 are considered undervalued.
PEG = PE / Percentage Growth Rate
PEG = 18 / 15 = 1.2
The growth component is important because investors don't want to buy something that won't increase in value. What investors tend to look for when buying shares with a low PEG ratio is a history of growth in combination with projected growth, which can help validate an undervalued PEG ratio.
The higher the PEG ratio, the more the company is valued, therefore the lower the value, the undervalue the company is. When both the PE and PEG ratios are high then they are good indicators that the company is overvalued.
1.6 PB Ratio = Price/Book Ratio
The P/B ratio helps us understand whether a company's stock is priced fairly compared to the value of its assets.
The price to book ratio is computed by taking the market capitalisation and dividing it by the book value of the company. We can also compute it by taking the current share price and dividing it by the book value per share.
The book value is the difference between the assets and liabilities.
Imagine if all of the assets of a company are liquidated to pay all of the liabilities then whatever we are left with is known as book value. The market value on the other hand is the price that the market values the company as.
P/B Ratio of 1: If the P/B ratio is 1, it means the stock is trading at a price that matches exactly with the company's book value. It's like saying, "You're paying exactly what the company's stuff (assets) is worth."
P/B Ratio Higher than 1: If the P/B ratio is more than 1, it suggests you're paying a bit more than what the company's stuff is worth. People might be willing to pay a premium because they believe the company is doing really well.
P/B Ratio Less than 1: If the P/B ratio is less than 1, it could mean the stock is a bit of a bargain. You might be paying less than what the company's stuff is worth. Some investors might see this as an opportunity.
How to Calculate P/B Ratio:
You find the P/B ratio by dividing the stock price by the book value per share. The book value per share is like the value of each piece of the company, considering what it owns and owes.
Example in Simple Terms:
Imagine a company called ABC with 100 million pieces of ownership (shares). If ABC has things (assets) worth $800 million but owes $125 million (debts), the book value for each piece (share) is about $6.75.
Now, if ABC's share is being sold for $5, you can find the P/B ratio by dividing $5 by $6.75. The result is around 0.74.
What 0.74 Means:
In simple terms, a P/B ratio of 0.74 suggests that you're getting a bit of a deal. You're paying less than what each piece of the company is theoretically worth.
Remember, the P/B ratio is just one tool. Investors use it to figure out if a stock is expensive, a good deal, or somewhere in between. It's like comparing the price tag to what's inside the box to decide if it's a good buy.
1.7 Debt-to-equity, or D/E, ratio
Similar to a company's book value, we also reverse the term for this last ratio, seeking to find out what a company owes relative to what it owns. The calculation is simple, and the figures for a firm's total debt and shareholders' equity can be found on the consolidated balance sheet.
A high D/E ratio indicates a company has borrowed heavily. That could mean the company is leveraging its assets to finance growth, but it also might signal the company is unprofitable and is surviving by borrowing rather than generating revenue. The question investors want to consider is whether the debt is increasing earnings by more than the cost of the debt, or whether the debt is weighing the firm down with loan payments and other liabilities.
You can calculate the ratio by dividing the total liabilities by the total shareholder equity. Check out the consolidated balance sheet below. It shows that Apple Inc. recorded a total of $241 billion in liabilities (highlighted in red) and total shareholders’ equity of $134 billion (highlighted in green).
Based on these figures, debt-to-equity ratio = $241,000,000 ÷ $134,000,000 = 1.80
Low Debt to Equity (Less than 1): If the ratio is less than 1, it suggests that the company is using more of its own money than borrowed money. It's like saying, "For every dollar the company owns, it owes less than a dollar to someone else." This is generally considered less risky.
High Debt to Equity (More than 1): If the ratio is more than 1, it means the company has more debt compared to its own money. It's like saying, "For every dollar the company owns, it owes more than a dollar to someone else." This can be riskier because the company needs to manage and repay borrowed money.
1.8. Return on Equity (ROE)
ROE is a profitability ratio that signifies the rate of return a shareholder receives for the portion of their investment in that company. It measures how well a company generates positive returns for its shareholders’ investments. Since profit is an actual driver of stock prices, separating out the profits earned with shareholder equity is actually a pretty good indicator of the financial health of a company and the fair value of its stock. You can calculate Return on Equity by dividing net income by average shareholders’ equity.
ROE tells us how good a company is at making money with the money its owners have invested.
It's like asking, "For every dollar the owners put in, how many more dollars are they getting back in profit?"
How to Calculate ROE:
You find ROE by dividing the company's net income (profit) by its average shareholders' equity (the owners' investment).
It's like saying, "What percentage of the owners' money turned into profit?"
Example:
If a company has a net income of $10 million and average shareholders' equity of $50 million, the ROE is 20% (10/50 * 100).
DuPont Analysis:
DuPont analysis breaks down ROE into three parts to understand what's driving it: Profit Margin, Turnover Ratio, and Leverage.
Profit Margin:
Profit Margin is how much profit a company makes for every dollar of revenue.
If a company makes $20 million in profit from $100 million in revenue, the profit margin is 20%.
Turnover Ratio:
Turnover Ratio is how efficiently a company uses its assets to generate revenue.
If a company has $200 million in revenue with $100 million in assets, the turnover ratio is 2.
Leverage:
Leverage is the use of borrowed money to increase the return on equity.
If a company has $100 million in assets and $50 million in equity, the leverage is 2.
DuPont Formula:
ROE = Profit Margin x Turnover Ratio x Leverage
ROA
Return on Assets (ROA):
ROA is like looking at how efficiently a company uses its assets to make a profit.
It's calculated by dividing net income by total assets.
ROA Formula:
ROA = Profit Margin x Turnover Ratio
Example:
If a company has a net income of $15 million and total assets of $100 million, the ROA is 15%.
Putting it Together:
ROE is essentially ROA multiplied by Leverage.
ROE Formula:
ROE = ROA x Leverage
Example:
If the ROA is 15% and Leverage is 2, then ROE would be 30%.
Understanding ROE helps investors see not just how much money a company is making but also how efficiently it's using its resources and borrowed money to generate profits for its owners. It's like a snapshot of how well a company is doing in making its investors happy.
2. Relation between EPS and PE
Earnings Per Share (EPS):
EPS is like a slice of the company's profits that each shareholder gets for each share they own. It shows how much money the company made for each share of its stock. The formula for EPS is:
EPS=Net Income / Number of Outstanding Shares
For example, if a company earned $1 million in profit and has 1 million shares, the EPS would be $1.
Price-to-Earnings (P/E) Ratio:
P/E ratio tells you how much investors are willing to pay for each dollar of earnings. It's like the price you're willing to pay for a slice of the company's profits. The formula for P/E ratio is:
P/E Ratio=Stock Price / Earnings Per Share (EPS)
For instance, if a stock is trading at $20 per share, and the EPS is $1, the P/E ratio is 20.
Relationship:
High EPS: If a company has a high EPS, it means it's making a good profit for each share. Investors might be willing to pay more for each share because the company is doing well.
Low P/E Ratio: If the P/E ratio is low, it might suggest that investors are not willing to pay much for each dollar of earnings. This could be because they don't expect the company to grow much or there might be some concerns.
High P/E Ratio: Conversely, a high P/E ratio suggests that investors are willing to pay more for each dollar of earnings. This might indicate high expectations for future growth.
Example:
Let's say Company ABC has a net income of $10 million, and it has 5 million shares outstanding. The EPS would be $2 == ($10,000,000 / 5,000,000).
If the stock is trading at $30 per share, the P/E ratio would be 15 == ($30 / $2).
So, in simple terms, investors are willing to pay 15 times the company's earnings for each share.
Remember, a high or low P/E ratio alone doesn't tell the whole story. It's often important to compare it with other similar companies and consider the company's growth prospects and overall market conditions.
3. Income Statement
3.1 Profit Margin
Profit margin is an important measure as it helps us understand the degree to which the company is generating income over its revenue. It is the ratio of the net income of a company over its revenue.
Therefore, if a company generates less income than its revenue then it will have a lower profit margin. It is a measure of a company’s efficiency.
These figures are available in the income statement of a company.
A company that generates a higher profit margin generates higher income when compared to its expenses and therefore is considered a healthier company.
3.2 Operating Margin
The operating margin is another measure of profit.
It is calculated by dividing the operating profit by the sales revenue. The profit is computed by calculating the difference between the revenue and all of the costs of a company.
These figures are available in the income statement of a company.
We might be able to conclude that the higher the operating margin, the profitable the company with lower costs.
4. Balance Sheet & Dividends
4.1 Current Ratio
The current ratio is one of the important balance sheet ratios to consider. It is a liquidity ratio and can inform us about the health of a company. It indicates whether the company can pay off its short-term debt.
It is calculated by dividing the current assets over the current liabilities.
The key to remember is that the higher the current ratio, the better the company can be considered for investment.
It is a good indication to invest in a company that has higher assets than its liabilities.
The current ratio should be greater than 1 indicating that it can pay-off its liabilities without borrowing the money.
4.2 Cash Per Share
Cash per share is a financial metric that represents the amount of cash a company has on hand for each outstanding share of its common stock. It is calculated by dividing the total cash and cash equivalents by the number of outstanding shares.
The more cash there is in a company, the more the business can spend on itself and make positive changes for the shareholders by growing the company or its products as an instance.
4.3 D/S Ratio = Total Debt/Equity Ratio
This measure is calculated by taking the ratio of liabilities of a company by the equity of the company.
Remember the equity of a company is the difference between its assets and liabilities. Therefore, a positive number is considered healthier.
Companies that have a higher debt ratio can potentially default on their debt therefore it’s wise to choose a company with lower debt to equity ratio and ensuring that it is a positive number.
4.4 Payout Ratio
The payout ratio is directly related to the dividends that the company pays to its shareholders. Some of the most established companies pay a percentage of their earnings to their shareholders.
The payout ratio is calculated by dividing the dividend amount per share by the earnings per share.
Some companies do not pay dividends whereas some companies invest a large portion of their income back into their business. When the payout ratio is low then it could mean that the company is investing back into its business. This again could imply, that the company is expanding.
When the payout ratio is high (higher than 100) then it means the company is paying more in dividends than its earnings.
5. Price is Just a number:
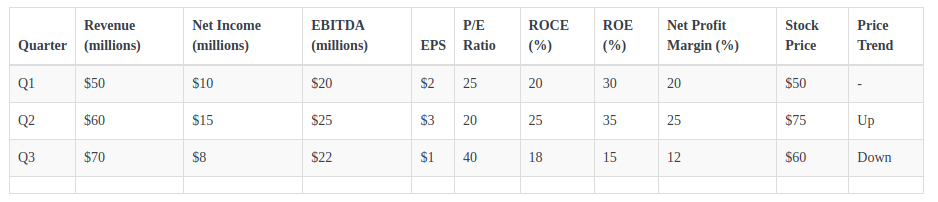
Quarterly Financial Metrics:
Revenue: Represents the total sales generated by the company in each quarter.
Net Income: Reflects the company's profit after all expenses.
EBITDA: Measures the operating performance before interest, taxes, depreciation, and amortisation.
EPS (Earnings Per Share): Represents the earnings generated per share.
P/E Ratio (Price-to-Earnings): Indicates how much investors are willing to pay for each dollar of earnings.
ROCE (Return on Capital Employed): Measures the efficiency of capital usage.
ROE (Return on Equity): Reflects how well the company utilizes equity to generate profits.
Net Profit Margin: Indicates the percentage of revenue converted into net profit.
Impact on Stock Price:
Q1 to Q2: An increase in revenue, net income, and EBITDA positively impacts EPS, P/E ratio, ROCE, ROE, and Net Profit Margin. This could potentially lead to an increase in the stock price.
Q2 to Q3: Despite an increase in revenue and EBITDA, a decrease in net income negatively impacts EPS, P/E ratio, ROCE, ROE, and Net Profit Margin. This might lead to a decrease in the stock price.
5. Conclusion:
As we wrap up our exploration of fundamental analysis, it's clear that deciphering financial metrics is not reserved for Wall Street wizards. These numbers serve as the compass guiding investors through the dynamic landscape of the stock market, offering insights into the true value and potential risks of a company. The Price-to-Earnings ratio (PE), Earnings Per Share (EPS), Debt-to-Equity ratio, Return on Capital Employed (ROCE), and Return on Equity (ROE) are not just abstract figures but windows into a company's financial soul.
Armed with this newfound knowledge, you can make more informed decisions about where to park your hard-earned money. Fundamental analysis empowers you to distinguish between a fleeting trend and a solid investment opportunity, helping you build a robust and resilient portfolio.
In our upcoming article, anticipate a deep dive into a powerful code designed to fetch and analyse correlations among a myriad of financial ratios and indicators. This tool is not just a mere instrument; it's a catalyst for effective decision-making in the intricate process of selecting and screening stocks. Brace yourself for a transformative exploration that promises to elevate your investment strategy to new heights. Stay tuned for a coding adventure that will empower your financial decision-making like never before